Alan
3/11/2022 02:11:47 pm
Is there data on how many non-sexual assault Art 32s & CMs there were vs the sexual assault data over same period?
DON CHRISTENSEN
3/11/2022 03:34:58 pm
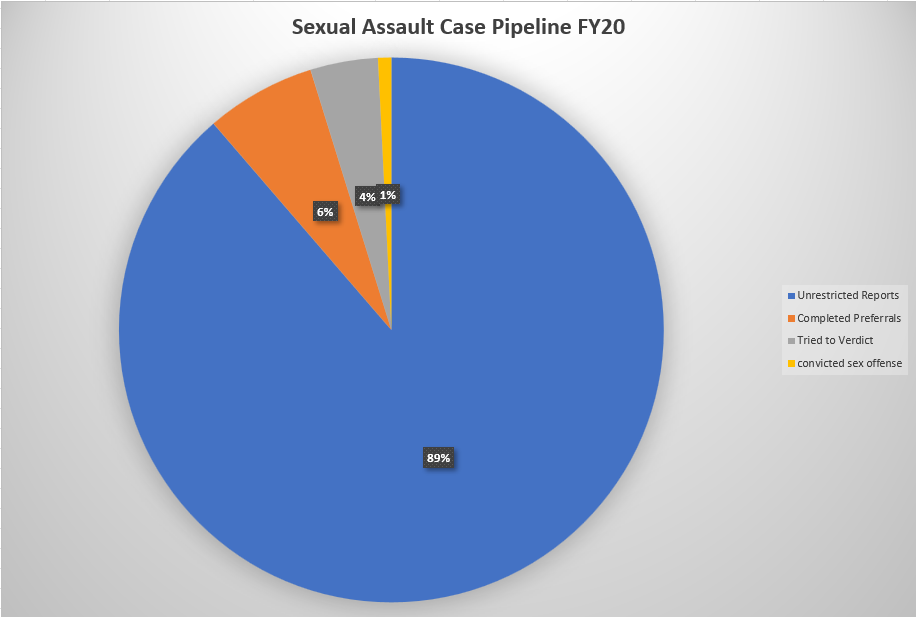
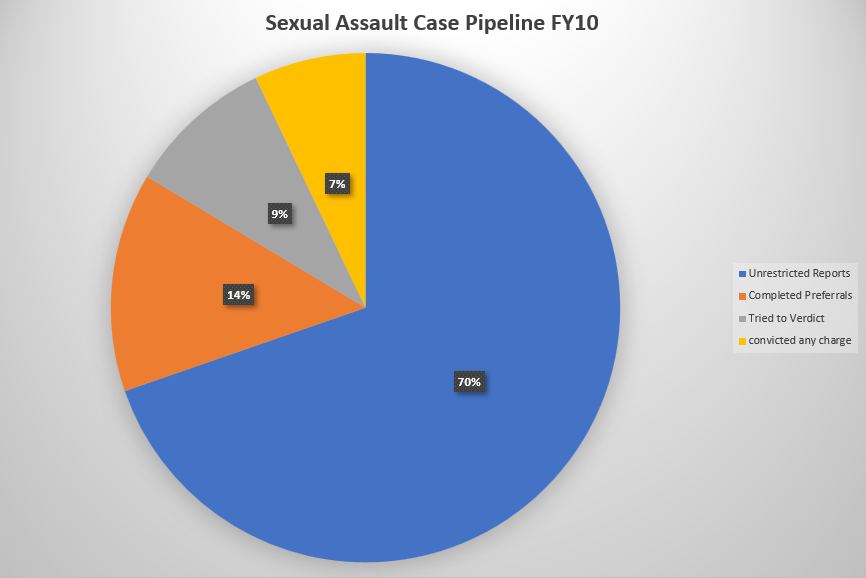
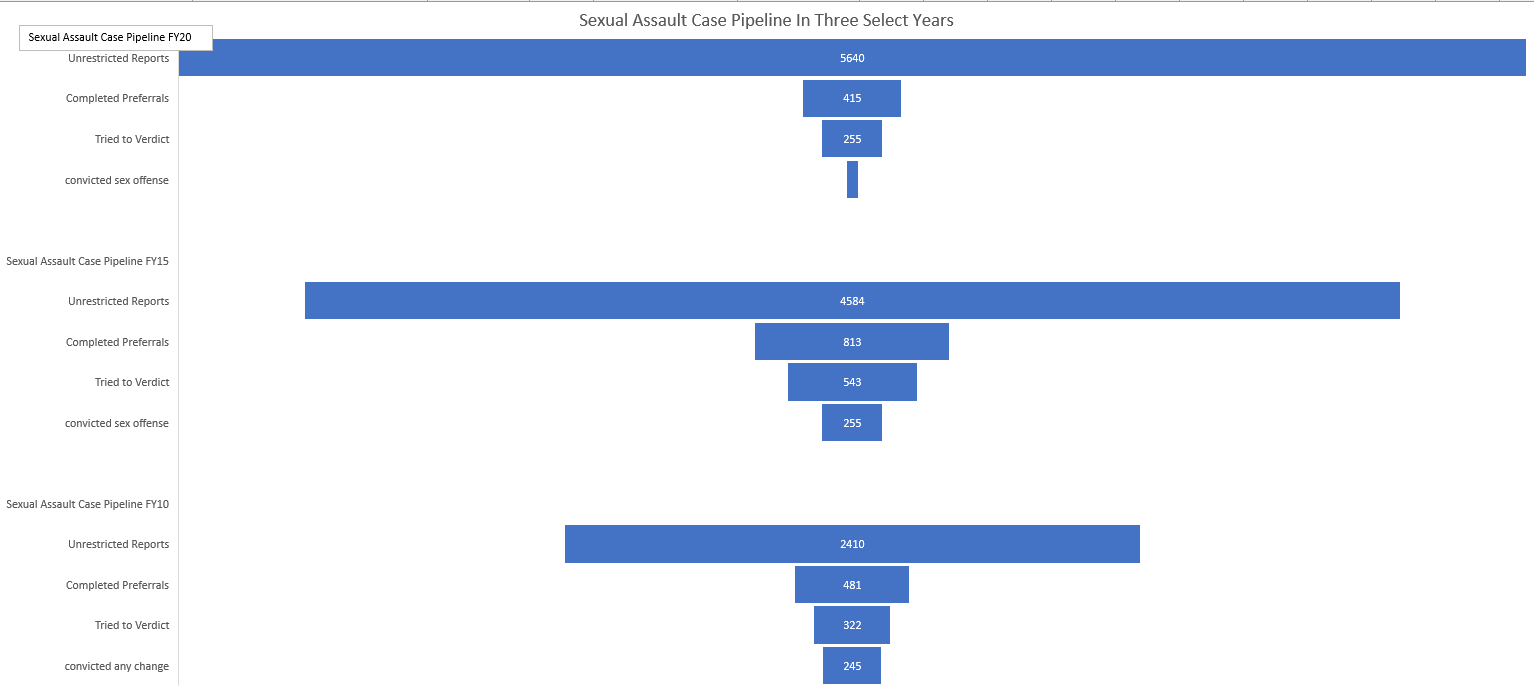
Alan in 2010 the services prosecuted 3162 general and special courts. Of those 481 or 15% were adult sex assault/rape cases. In FY20, the services prosecuted 1323 generals and special with 255 or 19% being adult sex cases. The data is available in the Article 146a reports and SAPR reports. I'm not aware of the data on Article 32s, but it may exist. 3/14/2022 02:10:16 am
And if the 32 data exists, should it not be in the annual reports.
Dwight Sullivan
3/14/2022 09:42:18 am
[Standard disclaimer: I make this comment purely in my individual capacity and it should not be attributed to anyone or anything else.] Wait a second -- the yellow slices represent different things in the two charts. It would also be helpful to depict the relative size of the two pies. Based on a quick review of the numbers, it appears that the FY 2020 pie is more than twice as large as the FY 2010 pie (5,640 unrestricted reports versus 2,579 unrestricted reports). I will try to drill deeper on those numbers this evening.
Brenner
3/14/2022 11:18:36 am
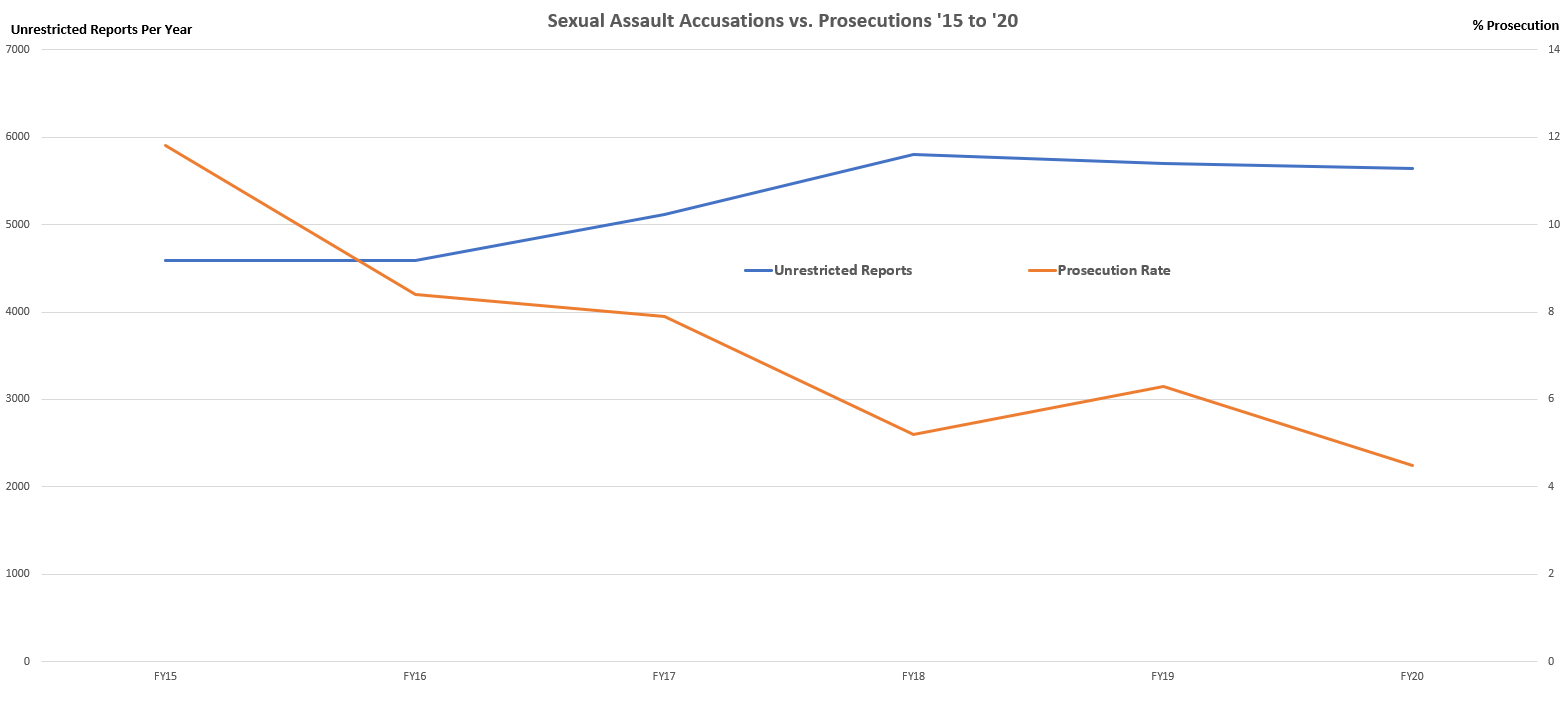
Yes: there is no sex specific data for the earlier year. I also realized the pie percentages are misleading since each smaller slice should be counted in the larger slices. So, only the smallest percentage is correct. The funnel chart illustrates the case pipeline best.
Dwight Sullivan
3/14/2022 01:09:59 pm
[Standard Disclaimer] I suggest changing the color of one of the two yellow slices; otherwise, the casual observer will think that they are depicting the same data set in the two pies. 3/14/2022 01:53:14 pm
Phil, and drilling down farther... Comments are closed.
|
Links
CAAF -Daily Journal -Current Term Opinions ACCA AFCCA CGCCA NMCCA Joint R. App. Pro. Global MJ Reform LOC Mil. Law Army Lawyer Resources Categories
All
Archives
April 2022
|
||||||||||||||||||||||||||||||||


